
 American
( English )
 Singapore ( English )


Heart rate variability and RMSSD are individual readings, so age charts locate you inside a population band and stop there. This guide covers what each metric measures, how to check an age reference table before trusting it, and how to build a fixed-condition personal baseline across multiple nights of data.
Learning how to read sleep tracker metrics starts the morning you search heart rate variability age reference values RMSSD charts and find numbers that disagree with your own. DeRUCCI's product documentation weighs any tracking metric by whether it leads to an action you can feel, and this guide applies the same standard to the readings on a sleep report. That disagreement is what tips a morning toward quiet worry or a shrug, and the workable third option is a method. It runs in three moves, what heart rate, HRV, and RMSSD each measure, what an age table honestly covers, and how a fixed-condition personal baseline turns a stray figure into a trend you can read.
What HRV and RMSSD Actually Measure
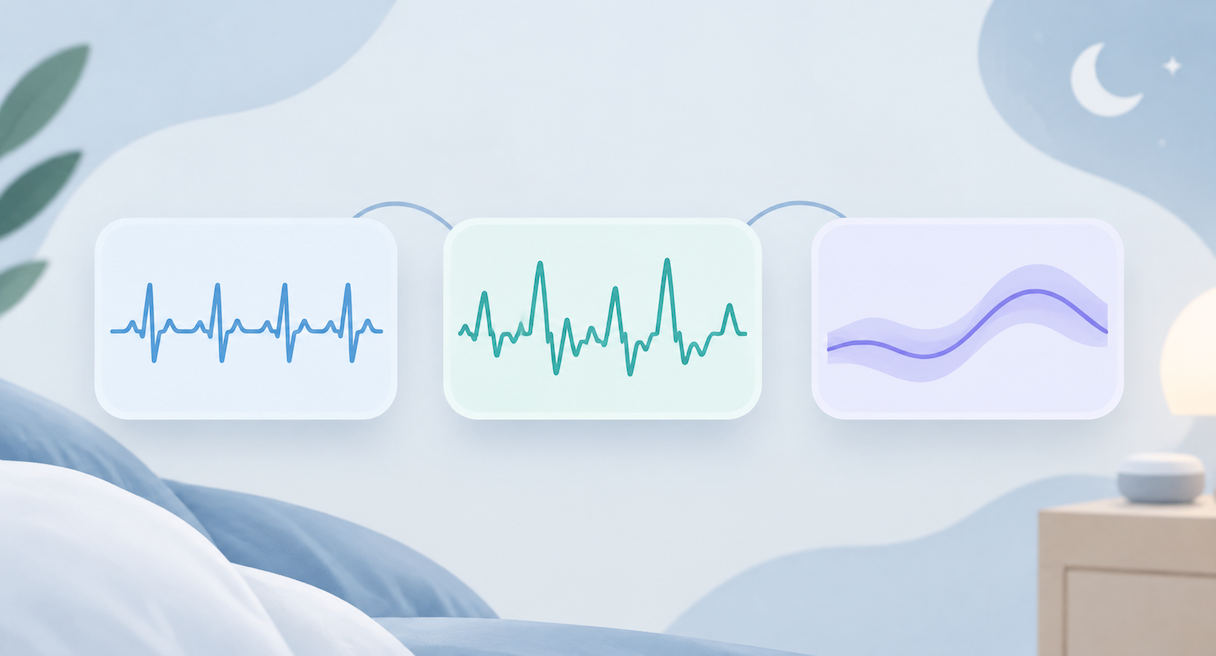
Three numbers sit at the center of most sleep reports. Heart rate counts beats per minute, heart rate variability tracks the variation in the gaps between those beats, and RMSSD summarizes that variation as one nightly figure. None of the three carries a good or bad label on its own, because each describes a state your body moves through.
Heart rate is the count most trackers put first, beats per minute across the night. It moves for ordinary reasons, an evening run, a late coffee, the pace of your wind-down, so its value builds night over night into a picture of your days.
Heart rate variability is the subtler measurement. Between two consecutive beats sits a small gap, and those gaps vary from pair to pair. HRV quantifies the variation itself, and because it tracks the continuous rebalancing of the nervous system between active and restful states, it serves as a window on regulation. The rebalancing never stops, which is exactly why the reading carries information.
RMSSD condenses the same signal into one figure. The name unpacks as the root mean square of successive differences between beat-to-beat intervals, the most commonly quoted time-domain measure of that variation, and it is typically calculated over long overnight stretches where the math holds steadier. A nightly RMSSD line is that condensation.
None of the three numbers ships with a verdict attached. A higher or lower HRV reading describes a regulation state, and the state shifts with sleep phase, recovery, and load. The reading method for all three runs through comparison with your own history, and the next two sections build that comparison.
(This image is AI-generated for reference only, not an actual product photo.)
Why Age Charts Can't Judge Your Numbers
Age charts answer a placement question, and placement is where their authority ends. Individual variation between adults spans tens of milliseconds, wide enough that two people can hold the same RMSSD figure with completely different day-to-day patterns. Conditions move the reading too, so the chart locates you and your baseline does the judging.
The pull toward an age table is understandable, because age reference values are exactly what a search box promises after a confusing morning. According to published guidance on reference ranges, such tables describe how readings distribute across age groups, and the distributions shift with the measurement method and the population sampled. That is placement information, useful and bounded.
Using a table honestly takes two checks, one required and one advisory in spirit. Matching the metric is required before any comparison means something, so confirm the table reports RMSSD itself, with the device class and measurement window matched to the table's basis. The placement it returns stays advisory, a line of context behind your own trend.
What the chart cannot do is judge. The tens-of-milliseconds spread between individuals means the same figure can sit mid-range for one person and at an edge for another, and the chart holds no way to tell those two situations apart. Conditions move the reading as well, sleep state, alcohol, training load, the timing of the measurement, and a table carries none of that with it.
Two columns keep the boundary honest.
| An age chart is built for | An age chart breaks down when |
|---|---|
| Placing your reading inside a rough population band | Certifying one night as good or bad |
| Comparing research groups measured under matching conditions | Lining your number up against a partner's or a friend's |
| Watching how group averages drift with age | Comparing outputs across devices or across different HRV measures |
One gap deserves daylight. No dedicated agency page for HRV age tables is among the sources verified here, so no age-by-number chart appears here, and the reference of record for any table you do find is the agency page as it reads on the day you check it, source and date included. For the scoring layer that wraps these readings into a single figure, what is a good HRV score is the companion read on this site.
Building a Baseline You Can Actually Use
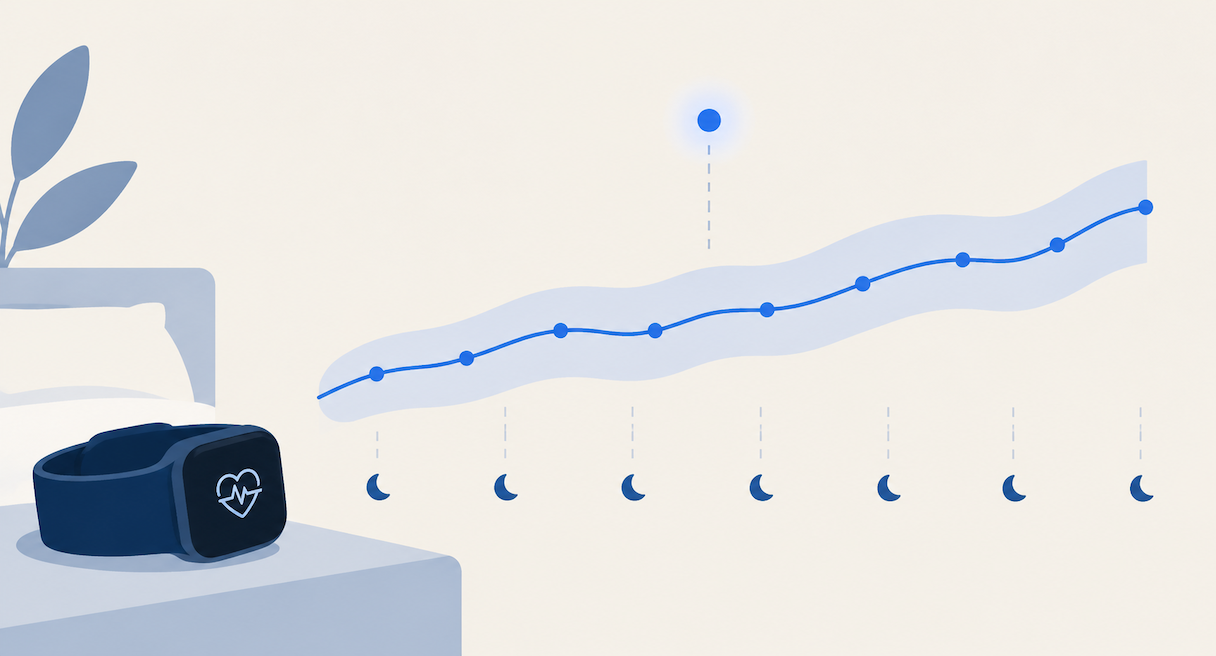
Build the baseline under fixed conditions before reading any single number. Hold the device, the measurement window, and the sleep setting steady, read the direction across multiple consecutive nights with each morning's figure kept as context, and work any unusual reading backwards through the conditions that preceded it. A trend earns attention, and a lone data point rarely does.
Fix the conditions first, because every later reading inherits them. The fixed-condition habit gives your numbers one stage to play on, and any change to the stage belongs in a note made before the number is read. Three checks carry most of the weight.
- Same device. Stay inside one tracker for the whole baseline, since devices apply different internal methods and the figures answer to different yardsticks.
- Same window. Keep the measurement stretch at the same time of night, so the reading describes the same part of your sleep each time.
- Same setting. Hold the sleep environment steady, and when travel or a new room changes it, write the change down next to the reading before interpreting either.
Then read the trend, with the single figure held as context. Owner feedback collected for this series keeps landing on one lesson, that a measurement earns its keep when it changes a decision, and a decision needs direction, which one night cannot supply. Watch the slope of the line across consecutive nights and the width of the band your readings move inside, and give the run of nights room to speak before adjusting anything.
An unusual reading gets worked backwards through conditions before it earns meaning. Alcohol, a late night, a hard training session, a shifted measurement window, each moves the number while saying nothing new about your sleep. A run of consecutive nights drifting in the same direction is the signal worth attention, and even then the productive questions are about your evenings and mornings, what changed, and what you would want to do about it. When a routine change is worth making, and how long to wait before judging it, is a timing question a companion page in this series takes up. For the single figure that rolls several trends together, what is a sleep score covers that layer.
Readings that stay far outside your own pattern across a long stretch are a different matter, and this page's self-check scope ends there.
(This image is AI-generated for reference only, not an actual product photo.)
Tracking Trends Without a Wristband
A wristband is one way to gather the trend, and a bed-based sensing layer is another. On the DeRUCCI T11 series, the sensing layer beneath the sleeper reads the night without contact and returns heart-rate readings along with sleep-structure trends, so the same fixed-condition baseline method applies with nothing to charge, wear, or remember.
The wristband route runs on a daily logistics load, the band has to be worn, charged, and remembered, and that load is where many tracking streaks quietly end. A sensing layer built into the bed removes the logistics. Nothing to strap on, nothing to charge, nothing to remember, and the night still gets read.
On the T11 series that layer lives under the sleeper. Per DeRUCCI's official product documentation, the sensing tier on the T11+ reads through the mattress surface during sleep and detects heart rate with 97% accuracy, and on the T11 PRO the SleepCare layer generates the daily reports. Two output families from that layer matter for this guide's method, the heart-rate trend and the sleep-structure trend, the arcs your sleep stages trace across a night and the way those arcs shift across weeks of nights.
The method carries over unchanged. Fix the conditions, read the multi-night trend, and work odd readings backwards through what changed, with the bed doing the collecting and you doing the reading. The mechanics behind contactless sensing have their own deep dive at how an AI smart mattress monitors sleep.
Frequently Asked Questions
---
Tracker metrics read clearly once each number holds one job, heart rate as the nightly pulse, HRV and RMSSD as regulation readouts measured against your own baseline, age charts as placement and nothing more. The wider ground is mapped by the series hub, from sleep problems to mattress choices, and to see the bed-based sensing tiers in person, find a store and check global showroom addresses.