
 American
( English )
 Singapore ( English )

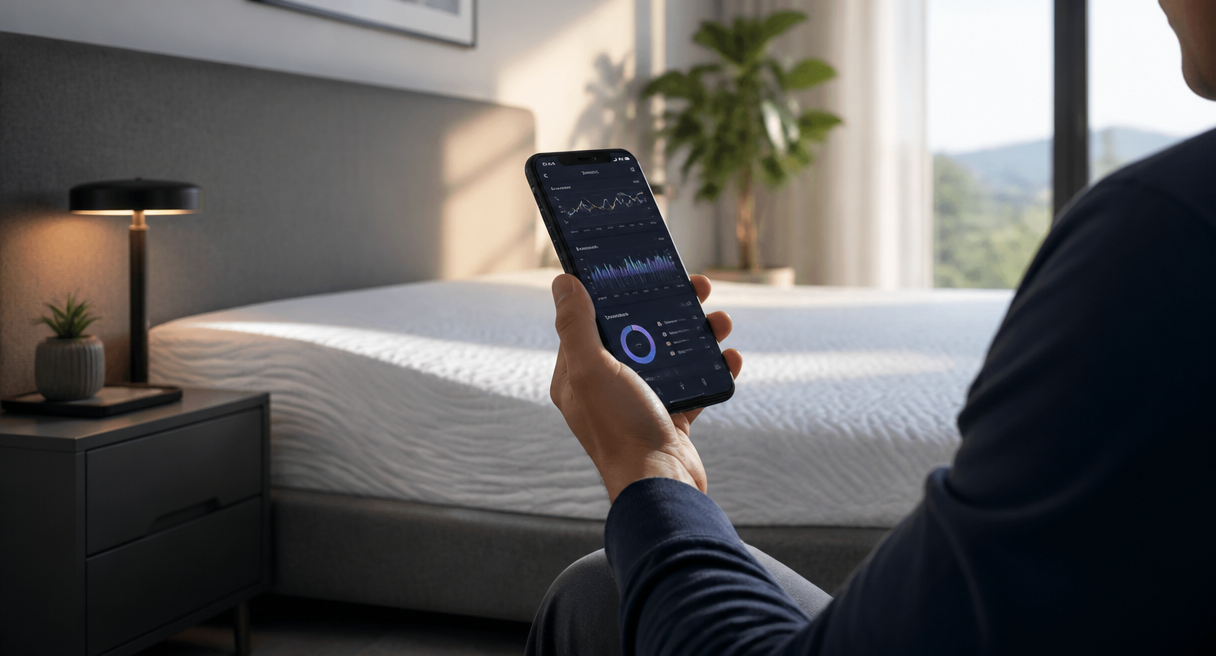
You know the same way you know training is working: the numbers and the feeling move together. A rising deep-sleep figure in the app proves little on its own. So does one good morning. On a DeRUCCI smart mattress, the workable method is to read the sleep report as a multi-night trend, write a short note each morning on how you actually feel, and compare the two over the same stretch of nights. When both point the same way for a couple of weeks, that is your answer. It comes down to four things: which metrics carry weight, where the numbers come from, how many nights make a trend, and which misreads to avoid.
Why Can't One Kind of Evidence Prove It Alone?
Neither your morning impression nor a report figure can carry the verdict alone. A morning verdict is one subjective sample, swayed by mood and by the alarm. A staging figure is an algorithm estimate with its own error band. Improvement shows when the multi-night data trend and the written morning record move together over the same window.
Why feel alone fails is familiar to anyone who has rated a morning "great" on three hours of optimism. The verdict is a single subjective sample, colored by mood, expectation, and the memory of the alarm clock rather than of the night. Why data alone fails is quieter: consumer-grade sleep staging is produced by algorithms, so a rising figure is a lead, not proof. Each kind of evidence covers the other's blind spot. That is the whole reason for running both at once.
Consumer sleep-tracking research supports the habit. A systematic review hosted by NIH (Robbins 2019) covers this ground. And someone who tracked every sleep variable for ninety straight days ended with a sentence that explains why any of this is worth the trouble: "people do not want measurement for its own sake; they want a measurement that leads to a decision." Verification is not a hobby. It exists so that you change something.
Where Do the Deep-Sleep Numbers Come From?
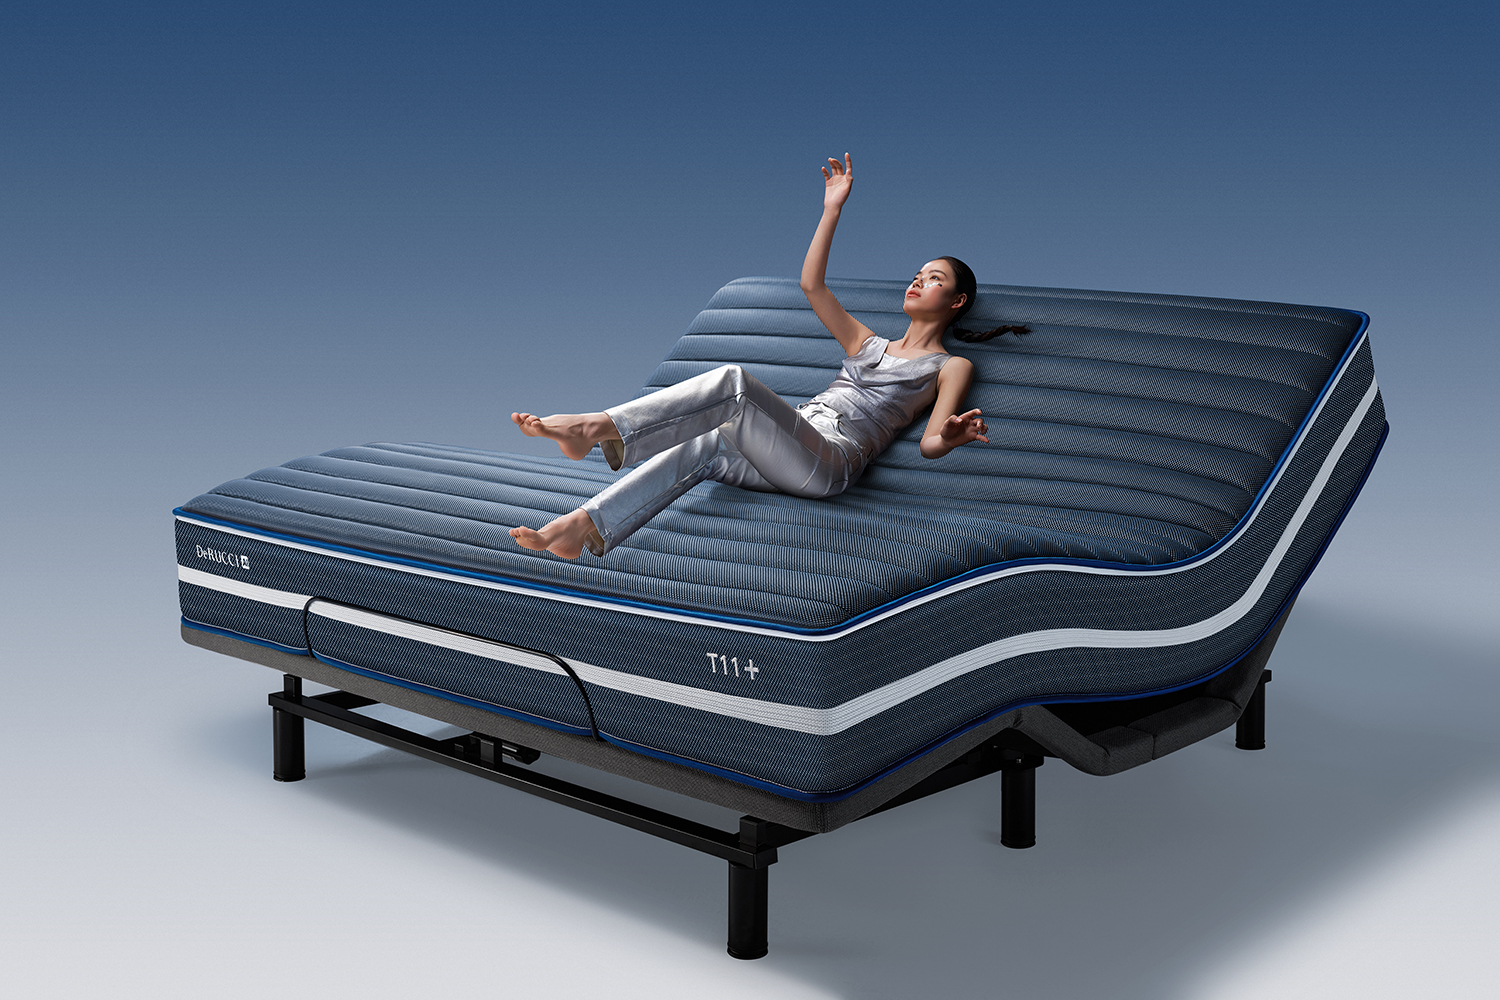
Know the chain behind every figure before you trust it. Sensors built into the bed surface, nothing worn, capture heart rate, breathing, sleep-stage transitions, and body movement; the data reaches your account over Bluetooth and Wi-Fi and comes back as nightly reports and adaptive firmness changes. A night qualifies at three hours in bed, two asleep.
The chain runs in four links. Capture happens at the bed surface: non-wearable sensors read heart rate, breathing, sleep-stage transitions, and body movement, with no wristband to wear or charge. Transmission is short-range wireless; the mattress pairs with a phone app over Bluetooth and Wi-Fi, and the effective range drops sharply through walls. Storage is a cloud backup bound to your account. Use is what returns to you: nightly reports, adaptive firmness changes, or both.
DeRUCCI's official information adds two scoping notes here. The T11+ sensor layer tracks heart rate, breathing, body movement, and sleep staging through the night, zero wearables, with around-the-clock insight. The SleepCare layer, including CPC cardiopulmonary coupling analysis, that generates the heart-rate, breathing, and sleep-staging daily report belongs to the T11 PRO; the T11+ report comes straight from its sensor layer, without that label. Generation conditions finish the picture: at least three hours in bed, at least two hours of actual sleep, together more than two 60–90 minute sleep cycles, recorded between 20:00 and 10:00 local time outside mainland China. For how a night becomes these readings, How AI Smart Mattresses Track Sleep Health explains the monitoring chain end to end.
Which Metrics Are Worth Verifying Against?
Run every metric through one question: what can this number change tonight? Readings wired into adjustment, zone-level support, firmness adaptations, can anchor a verdict, because a change in the reading corresponds to a change in what the bed does. Display-only numbers stay context.
The standard is an old one in sleep tracking: a number earns its place when it changes something you can feel the next morning, a firmer lumbar region, a softer shoulder region, a noticeably different quality of support. Precision is not the point. Usefulness is. A reading that only ever appears on a screen can climb for weeks while nothing in your sleep actually shifts.
So sort your report into two groups. In the first go the readings tied to adjustment: zone-level support changes, firmness adaptations, anything that can alter what tonight's bed does or what you decide tomorrow. Build your improvement judgment on these, trend-checked across nights. In the second go the display-only quantities, stage shares, the nightly shape of the report, background rhythms. They help you read the first group, but they never carry a verdict by themselves.
What Should You Write Down Each Morning?
Three short notes, taken the same morning: how the lumbar support felt, how the shoulder zone felt (any pressure residue), and a one-line overall rating. Keep them inside the same window the report data covers. Written notes resist the editing your memory does; impressions from two weeks ago do not.
The three questions take under a minute. How did the lumbar support feel? How did the shoulder zone feel, any pressure residue? How would you rate the night overall? Answer them in writing, the same morning, before the day smooths the night into a blur. The discipline is small; without it, your "felt" evidence quietly becomes a summary of your worst alarm clocks.
Where those sensations come from is described in DeRUCCI's official framing: before sleep, sleepiness is scientifically guided; after sleep, waking is stabilized to avoid morning fatigue. Keep one boundary clear, though. The morning record is a self-check on your own sleep. It is not evidence of what any product did, and it does not travel beyond you.
How Many Nights of Deep-Sleep Data Make a Trend?
Anchor expectations in general sleep science, kept separate from any product page: four to five cycles of 90–120 minutes, deep sleep front-loaded, REM back-loaded, adult deep-sleep share around 10–20% (an N3 span of 13–23% is also cited). The verdict rule: both lines, report trend and morning record, pointing the same way across the same nights.
Those benchmarks are general science, stated separately from product figures, and they set the frame for reading your own data. A normal night runs four to five cycles; deep sleep concentrates in the first half, REM in the second. When your multi-night trend and your morning notes agree in direction over the same window, the evidence that deep sleep is improving holds up.
When they disagree, nobody wins yet. Check the data side first: did the nights in question meet the generation thresholds, and are you trending adjustment-linked metrics or display-only ones? Then check the notes: did one dramatic morning steer a whole week's record? Divergence usually means one of the two lines was built on sand. Fix the premise and look again. For how the app compresses a night into a single summary number, What Is a Sleep Score? explains the weighting.
Which Misreads Lead People Astray?
Four misreads account for most false conclusions: verdicts from a single night, missing reports read as decline, display-only numbers trended as if they meant something, and adjustment-mode switches buried mid-window. No staging-accuracy figure exists for the T11 series; the 97% spec covers resting heart rate only. Reports are wellness features.
Take them in order. One night's deep-sleep minutes are an estimate, and estimates wobble. A missing report usually means the thresholds were not met, not that sleep collapsed. A display-only number can move for reasons unrelated to your nights. And a mode change in the middle of a window quietly merges two different experiments into one unreadable trend.
Before calling it, run five questions over the whole exercise: where do the readings come from, bed-surface sensors or the app's presentation; did the night meet the generation conditions; is the metric tied to adjustment; do the morning notes cover the same window as the data; and do the two lines point the same way? The first four decide whether the fifth is a judgment or a guess.
One specification belongs in the record for completeness: the T11+'s average resting heart-rate accuracy of 97%, a manufacturer specification for that metric alone. Deep-sleep staging is read as a trend, never as an absolute. And the usual caveat applies throughout: monitoring and report functions are wellness features, not intended for medical diagnosis or treatment.
To run the method on your own nights, find a store near you and try the T11 series' non-wearable monitoring and reporting; confirm availability in your region at the same visit.